Welcome to the 2GNT Forum! Interested In Advertising with 2GNT?
Home | Site Background| Info&Specs| Mods & Tech Info | CAPS | Part Reviews | Donate | 2GNT Stickers |
Search Printer-friendly copy 1 User in Chat
Top 2GNT Technical Turbo/Nitrous Tech topic #108509
View in linear mode

Subject: "Challenge: plot your setup on the compressor map" Previous topic | Next topic
AdministratorCODE4Feb-12-11 10:02 PM
Member since Nov 23rd 2003
2552 posts,
Click to send email to this author Click to send private message to this author Click to view this author's profile Click to add this author to your buddy list
#108509, "Challenge: plot your setup on the compressor map"
Feb-13-11 01:35 PM by CODE4


I wanted to know where I was operating my 2.4L & GT3076R with regard to the compressor map. I grabbed the map off of Garrett's site and referencing the math available at http://www.turbobygarrett.com/turbobygarrett/tech_center/turbo_tech103.html - I began plugging in constants.

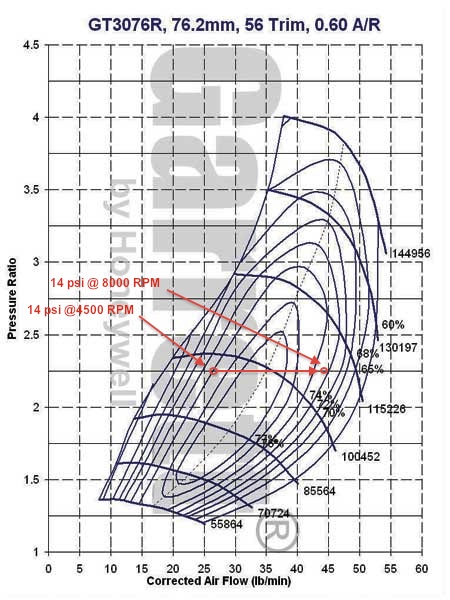
If you check the math below, I used an AFR of 12, a BSFC of .55, and intake manifold temperatures of 130. Target BHP is 400. I am actually running 19 psi, I used 14 psi as that was the figure I arrived at through calculations for target 400 bhp.

If you are bored or curious, locate your compressor map and plot your positioning.


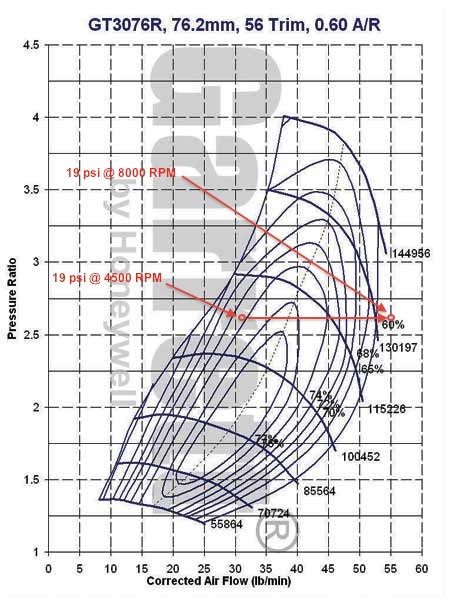
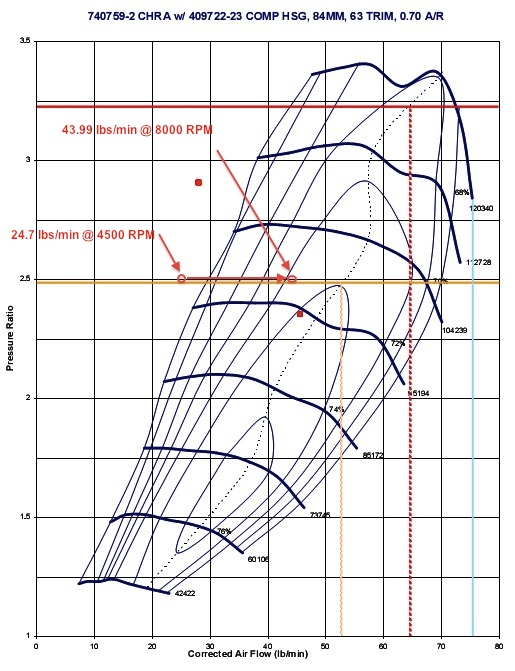
***I just did the math and plotted my actual placement on the map, at 19 psi. As you can see at 8000 RPM (Doubt that I would ever touch this area in the 2.4L) I am past the compressor's choke point.


---

2012 2500HD LML


Report This Post to Admin Printer-friendly copy | Reply | Reply with quote | Top

Replies to this topic
RE: Challenge: plot your setup on the compressor map, Global Ruler Of All ThingsDarkOne, Feb-12-11 11:31 PM, #1
RE: Challenge: plot your setup on the compressor map, Slo2g, Feb-12-11 11:43 PM, #2
      RE: Challenge: plot your setup on the compressor map, AdministratorCODE4, Feb-13-11 07:40 PM, #3
           RE: Challenge: plot your setup on the compressor map, Slo2g, Feb-16-11 09:59 PM, #4
                RE: Challenge: plot your setup on the compressor map, 420agreenvilleSC, Feb-17-11 08:31 AM, #5
                RE: Challenge: plot your setup on the compressor map, AdministratorCODE4, Feb-17-11 09:03 AM, #6
                     RE: Challenge: plot your setup on the compressor map, Slo2g, Feb-17-11 12:09 PM, #7
                          RE: Challenge: plot your setup on the compressor map, AdministratorCODE4, Feb-17-11 06:51 PM, #8
How To Read Turbo Compressor Map | Explained, AdministratorCODE4, Feb-17-11 07:51 PM, #9
RE: How To Read Turbo Compressor Map | Explained, 420agreenvilleSC, Feb-18-11 08:02 AM, #10
      RE: How To Read Turbo Compressor Map | Explained, Slo2g, Feb-18-11 08:30 AM, #11
           RE: How To Read Turbo Compressor Map | Explained, AdministratorCODE4, Feb-18-11 01:34 PM, #12
                RE: How To Read Turbo Compressor Map | Explained, Slo2g, Feb-18-11 01:48 PM, #13

Global Ruler Of All ThingsDarkOneFeb-12-11 11:31 PM
Donating 2GNT member
14938 posts,
Click to send email to this author Click to send private message to this author Click to view this author's profile Click to add this author to your buddy list
#108510, "RE: Challenge: plot your setup on the compressor map"
In response to Reply # 0


This tells me you need to run more boost.

______________________________
If a sentence found online has 35% misspellings or greater and includes at least two racially charged expletives, chances are it is a YouTube comment.

'95 Eclipse TurboGS (garage deco)
'95 TSi AWD (restoring a survivor)
'97 Talon ESi-T (poor impulse control)
'99 Eclipse RS-T (daily beater)
'13 Evo X (mostly stock)
'17 Sienna (Middle Aged Dad Mobile)


Factory Service Manuals: http://nawdu.de/files/


Report This Post to Admin Printer-friendly copy | Reply | Reply with quote | Top

    
Slo2gFeb-12-11 11:43 PM
Member since Feb 10th 2006
1074 posts,
Click to send email to this author Click to send private message to this author Click to view this author's profile Click to add this author to your buddy list
#108511, "RE: Challenge: plot your setup on the compressor map"
In response to Reply # 1


hehe, if you can find the compressor map for me I'll post up. I emailed hahn a while back and they told me they didn't have any info on it and to use the numbers from the Greddy T67. I was kind of set back from this but what ever. I still have been searching for the map from the Greddy T67 as well...just can't seem to find it....


Report This Post to Admin Printer-friendly copy | Reply | Reply with quote | Top

        
AdministratorCODE4Feb-13-11 07:40 PM
Member since Nov 23rd 2003
2552 posts,
Click to send email to this author Click to send private message to this author Click to view this author's profile Click to add this author to your buddy list
#108512, "RE: Challenge: plot your setup on the compressor map"
In response to Reply # 2
Feb-13-11 07:41 PM by CODE4


check this page: http://www.not2fast.com/turbo/maps/all.html#gt

http://www.rbracing-rsr.com/turbotech.html

---

2012 2500HD LML


Report This Post to Admin Printer-friendly copy | Reply | Reply with quote | Top

            
Slo2gFeb-16-11 09:59 PM
Member since Feb 10th 2006
1074 posts,
Click to send email to this author Click to send private message to this author Click to view this author's profile Click to add this author to your buddy list
#108518, "RE: Challenge: plot your setup on the compressor map"
In response to Reply # 3
Feb-16-11 10:17 PM by Slo2g


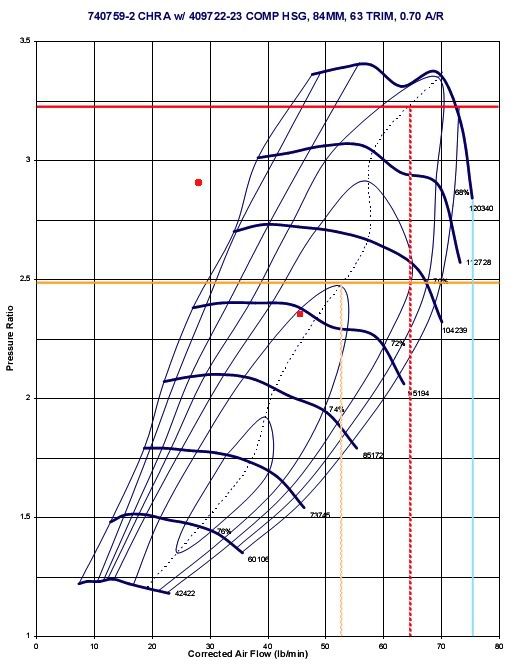
So I think I got it. I used the T04z compressor map because after some research( I could be wrong) I think this is the closest I could find to the S25g....any who here are my plots, the two red dots on the map. I used Dave's IAT's, pressure loss on intake and compressor outlet, and VE. This is also based off my 2.0 motor so its a 122.04 CI instead of Daves 2.4.


Pressure Ratio
(18+14.7)/13.7=2.387

Airflow
420*12*(.55/60)=46.2 lbs/min

Calculated Manifold Pressure
(46.2*639.6*590)/(.98*4000*122.04)= 36.443-14.7=21.74psig boost @ 8k RPM

Compressor Discharge PSI
36.443+2=38.443 psia

Compressor Inlet PSI
14.7-1=13.7 psia

Pressure Ratio
38.443/13.7=2.806

Airflow Actual
(38.443*.98*2250*122.04)/(639.6*590)=27.41 lbs/min @4500 RPMS

Something just doesn't seem right though. Maybe someone will correct me


Report This Post to Admin Printer-friendly copy | Reply | Reply with quote | Top

                
420agreenvilleSCFeb-17-11 08:31 AM
Donating 2GNT member
1527 posts,
Click to send email to this author Click to send private message to this author Click to view this author's profile Click to add this author to your buddy list
#108519, "RE: Challenge: plot your setup on the compressor map"
In response to Reply # 4
Feb-17-11 09:33 AM by 420agreenvilleSC


good thread dave. I didn't see anything wrong with your calculations zac but nevertheless, I suck at math. I don't know what's good or bad nor do I know if I calculated this correctly. As zac did, I used Dave's VE and IM temp #'s. I wanna do more reading on this... interesting.

T04E Specs:
3" INLET DIAMETER
2" OUTLET
JOURNAL BEARINGS
.57 COMPRESSOR WHEEL TRIM
.50 A/R COMPRESSOR
.63 A/R TURBINE

Pressure Ratio:
(16+14.7) / 13.7 = 2.241

Airflow:
350 x 12 x (.55 / 60) = 38.5 lbs/min

Calculated Mani Pressure:
(38.5 x 639.6 x 590) / (.98 x 3500 x 122.04)
14528514 / 418597.2 = 34.71
34.71 - 14.7 = 20.01 psig boost @7000 RPM

Compressor Discharge Pressure:
34.71 + 2 = 36.71 psia

Compressor Inlet Pressure:
14.7 - 1 = 13.7 psia

Pressure Ratio:
36.71 / 13.7 = 2.68

Airflow Actual
(34.71 x .98 x 1750 x 122.04) / (639.6 x 590)
7264754.406 / 377364 = 19.25 lbs/min @3500 RPM


___________________________________________


http://www.2gnt.com/quote_db.php?id=278

Outside of Corona: "That sucks, peace out..." (jamie walks away)... "Sweeet, what we doin?" -Zac
Tim's garage (prior to motor install): "Im gonna smoke real quick, that way if you fuck up I am already nicotined up" -Tim


Report This Post to Admin Printer-friendly copy | Reply | Reply with quote | Top

                
AdministratorCODE4Feb-17-11 09:03 AM
Member since Nov 23rd 2003
2552 posts,
Click to send email to this author Click to send private message to this author Click to view this author's profile Click to add this author to your buddy list
#108520, "RE: Challenge: plot your setup on the compressor map"
In response to Reply # 4


Zac, your plot is using two different boost pressures. That is why the plot is weird. Figure your actual boost pressure and use that figure for the last equation to find the actual air flow. In class on my phone right now, will check it when I get out.

---

2012 2500HD LML


Report This Post to Admin Printer-friendly copy | Reply | Reply with quote | Top

                    
Slo2gFeb-17-11 12:09 PM
Member since Feb 10th 2006
1074 posts,
Click to send email to this author Click to send private message to this author Click to view this author's profile Click to add this author to your buddy list
#108521, "RE: Challenge: plot your setup on the compressor map"
In response to Reply # 6


Maybe Dave, although I don't see how(don't know what I did wrong). I used 18psi and I actually used 420hp but it should be more(I was going off what my car actually made on the dyno and not crank hp.) I'm awaiting your responce


Report This Post to Admin Printer-friendly copy | Reply | Reply with quote | Top

                        
AdministratorCODE4Feb-17-11 06:51 PM
Member since Nov 23rd 2003
2552 posts,
Click to send email to this author Click to send private message to this author Click to view this author's profile Click to add this author to your buddy list
#108522, "RE: Challenge: plot your setup on the compressor map"
In response to Reply # 7
Feb-17-11 07:03 PM by CODE4


Originally posted by Slo2g
Maybe Dave, although I don't see how(don't know what I did wrong). I used 18psi and I actually used 420hp but it should be more(I was going off what my car actually made on the dyno and not crank hp.) I'm awaiting your responce


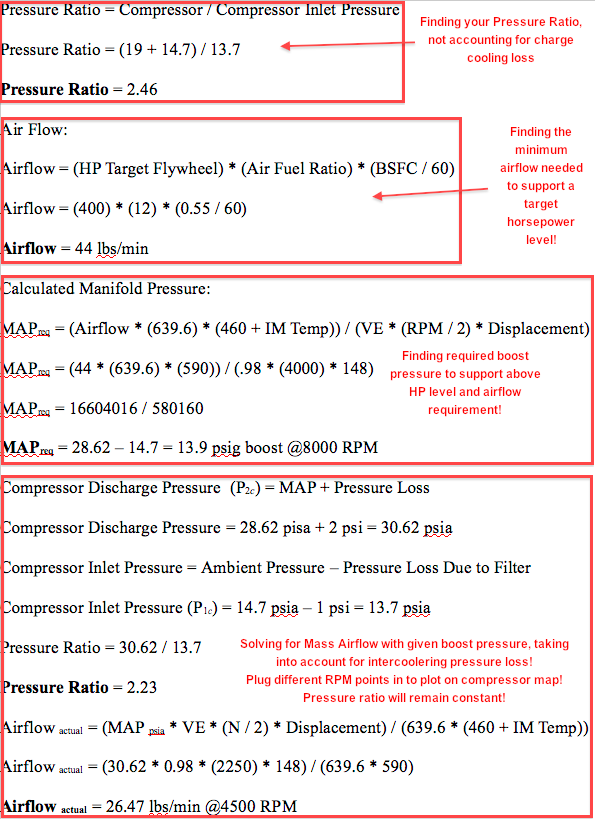
***Annotated worksheet in first post to make the different calculations clearer. Plotting points on compressor map with known boost pressure requires the last equations only!***

Zac, I think the confusion stemmed from my calculation example. Really, to plot the mass air flow all one needs to do is use the last equation to solve for Mass Air Flow. The MAP psia is Manifold Pressure + System Loss (I used 2 psi for this example) + atmosphere (14.7). The pressure ratio should be the same across different RPM points, unless of course boost creep is happening or you have a 2 stage boost controller.

AirFlow(actual) = ((MAP psia) * VE * (N/2) * Displacement) / (639.6 * (460 + IM Temp))

MAP psia = (Manifold Pressure) + (Atmosphere) + (system loss)

MAP psia = 18 + 14.7 + 2 = 34.7 psia

Pressure Ratio = (MAP + Pressure Loss) / (Compressor Inlet Pressure - Pressure Loss Due to Filter)

Pressure Ratio = 34.7 / 13.7

Pressure Ratio = 2.53

AirFlow(actual) = (34.7 * 0.98 * 2250 * 122.04) / (639.6 * 590)

AirFlow(actual) = 9337707.54 / 377364

AirFlow(actual) = 24.7 lbs/min @ 4500 RPM

AirFlow(actual) = 43.99 lbs/min @ 8000 RPM


---

2012 2500HD LML


Report This Post to Admin Printer-friendly copy | Reply | Reply with quote | Top

AdministratorCODE4Feb-17-11 07:51 PM
Member since Nov 23rd 2003
2552 posts,
Click to send email to this author Click to send private message to this author Click to view this author's profile Click to add this author to your buddy list
#108524, "How To Read Turbo Compressor Map | Explained"
In response to Reply # 0


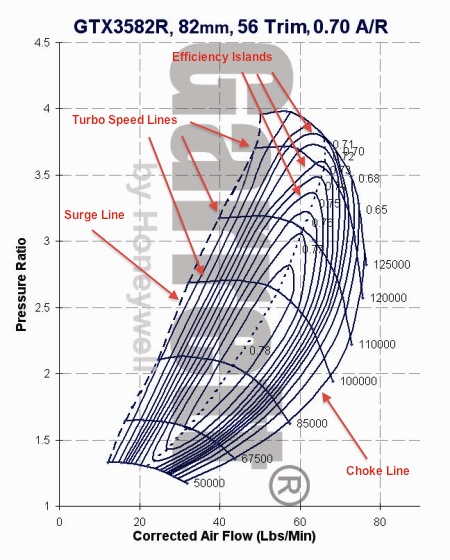
For those that have a tough time reading a compressor map, I will break it down so that using the calculations in the first post, you can easily find a compressor that will suit your needs.

Efficiency Islands: concentric islands referencing the compressor's efficiency - 0.78 = 78%, etc.

Turbo Speed Lines: the large numbers next to the somewhat horizontal lines that drop down towards the right side of the map. These lines refer to turbo speed at particular pressure ratio vs. air flow plots. At points between these lines, the turbo speed can be directly interpolated.

Surge Line: the dotted line on the furthest left of the compressor map. Air flow at or near this point is on the verge of compressor surge. For example, without the use of a BOV, when the engine is in boost and the throttle plate is slammed shut (for example, shifting gears) the pressure remains constant however the airflow drops hard to the left. Typically, compressor housings that have ported shrouds will have the surge line extended more to the left. Operating at or near the surge line is not healthy for the turbo.

Choke Line: compressor flow limit. Operating near this line approaches the point where the turbo tends to fall on its face (for example, 16G at 8000 RPM). As the compressor approaches this line the flow limit is reached and the compressed air temperature rises quickly.

When selecting a turbo, calculate your horsepower target using the calculations in the first post. Then calculate the required pressure to support that airflow and horsepower at desired RPM. Ideally, you want the majority of your time in boost to be in the highest efficiency island as possible. This will differ greatly for engines used specifically for drag racing (all time spent above 5000 RPM) or street applications where boost is desired at 2500 RPM.


---

2012 2500HD LML


Report This Post to Admin Printer-friendly copy | Reply | Reply with quote | Top

    
420agreenvilleSCFeb-18-11 08:02 AM
Donating 2GNT member
1527 posts,
Click to send email to this author Click to send private message to this author Click to view this author's profile Click to add this author to your buddy list
#108528, "RE: How To Read Turbo Compressor Map | Explained"
In response to Reply # 9


epic. thanks dave

___________________________________________


http://www.2gnt.com/quote_db.php?id=278

Outside of Corona: "That sucks, peace out..." (jamie walks away)... "Sweeet, what we doin?" -Zac
Tim's garage (prior to motor install): "Im gonna smoke real quick, that way if you fuck up I am already nicotined up" -Tim


Report This Post to Admin Printer-friendly copy | Reply | Reply with quote | Top

        
Slo2gFeb-18-11 08:30 AM
Member since Feb 10th 2006
1074 posts,
Click to send email to this author Click to send private message to this author Click to view this author's profile Click to add this author to your buddy list
#108529, "RE: How To Read Turbo Compressor Map | Explained"
In response to Reply # 10


Nice, Dave. Now here is another question. What happens to the eff chart when boost is introduced into the turbo via another turbo. Then inlet pressure would be positive and more than atmospheric. Where would that move the efficiency range?


Report This Post to Admin Printer-friendly copy | Reply | Reply with quote | Top

            
AdministratorCODE4Feb-18-11 01:34 PM
Member since Nov 23rd 2003
2552 posts,
Click to send email to this author Click to send private message to this author Click to view this author's profile Click to add this author to your buddy list
#108531, "RE: How To Read Turbo Compressor Map | Explained"
In response to Reply # 11


Hmm interesting question. Without searching/researching the intrawebz, I imagine you add the boost pressure feeding the turbo to 14.7 (atmosphere). Since the P1C is higher, the pressure ratio drops, placing you lower on the compressor map. Subsequently, you can up the boost pressure of the second turbo to bring P2C higher, and bringing your pressure ratio back up. So I would imagine that running sequential turbos allows the second turbo to be run at a much higher boost pressure without operating off the compressor map.

---

2012 2500HD LML


Report This Post to Admin Printer-friendly copy | Reply | Reply with quote | Top

                
Slo2gFeb-18-11 01:48 PM
Member since Feb 10th 2006
1074 posts,
Click to send email to this author Click to send private message to this author Click to view this author's profile Click to add this author to your buddy list
#108532, "RE: How To Read Turbo Compressor Map | Explained"
In response to Reply # 12


Exactly Looks like the lbs/min would jump up drasticly as well but staying within the turbos efficiency range meaning more airflow at a lower temp than just upping the boost. At least in theory...


Report This Post to Admin Printer-friendly copy | Reply | Reply with quote | Top

Top 2GNT Technical Turbo/Nitrous Tech topic #108509 Previous topic | Next topic
Powered by DCForum+ Version 1.2
Copyright 1997-2003 DCScripts.com

I generated this page in 0.088178873062134 seconds, executing 12 queries.