| Go back to previous topic | |
| Forum name | Turbo/Nitrous Tech |
| Topic subject | Challenge: plot your setup on the compressor map |
| Topic URL | https://forums.2gnt.com/dcboard.php?az=show_topic&forum=i8&topic_id=108509 |
|
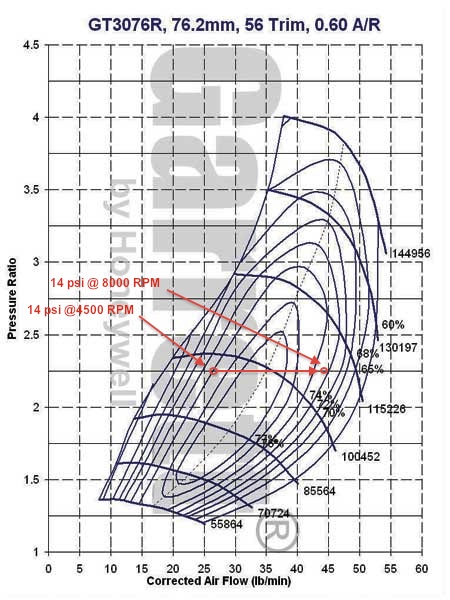
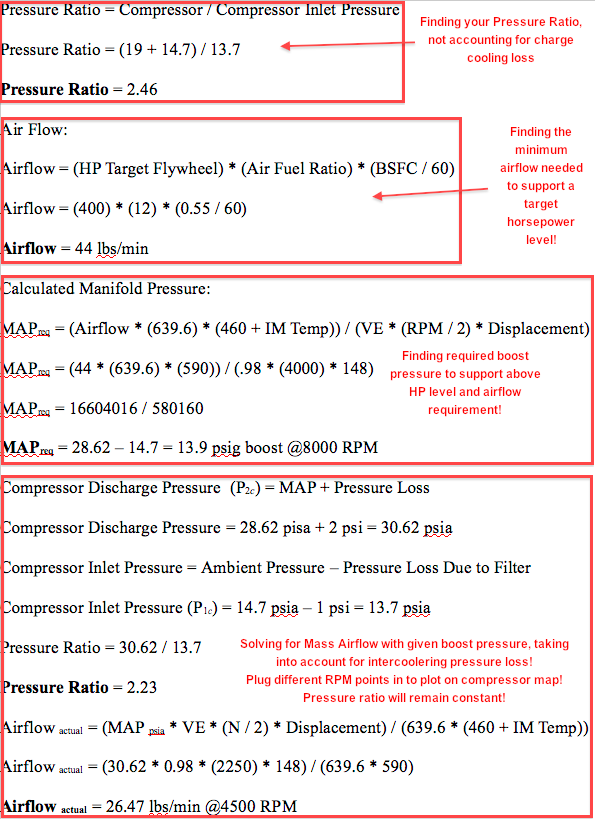
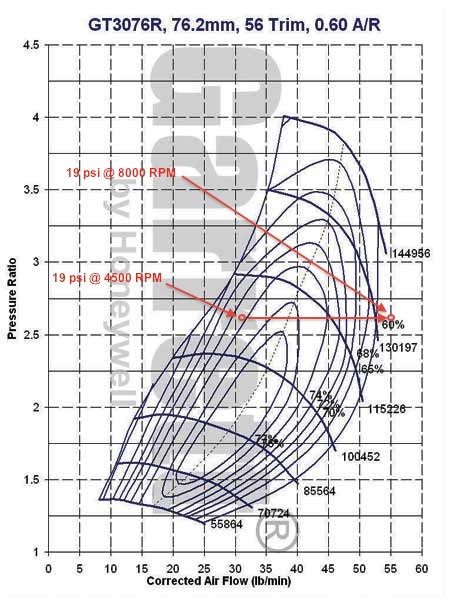
108509, Challenge: plot your setup on the compressor map Posted by CODE4, Feb-12-11 09:02 PM I wanted to know where I was operating my 2.4L & GT3076R with regard to the compressor map. I grabbed the map off of Garrett's site and referencing the math available at http://www.turbobygarrett.com/turbobygarrett/tech_center/turbo_tech103.html - I began plugging in constants. | |
|
108510, RE: Challenge: plot your setup on the compressor map Posted by DarkOne, Feb-12-11 10:31 PM This tells me you need to run more boost. | |
|
108511, RE: Challenge: plot your setup on the compressor map Posted by Slo2g, Feb-12-11 10:43 PM hehe, if you can find the compressor map for me I'll post up. I emailed hahn a while back and they told me they didn't have any info on it and to use the numbers from the Greddy T67. I was kind of set back from this but what ever. I still have been searching for the map from the Greddy T67 as well...just can't seem to find it.... | |
|
108512, RE: Challenge: plot your setup on the compressor map Posted by CODE4, Feb-13-11 06:40 PM check this page: http://www.not2fast.com/turbo/maps/all.html#gt | |
|
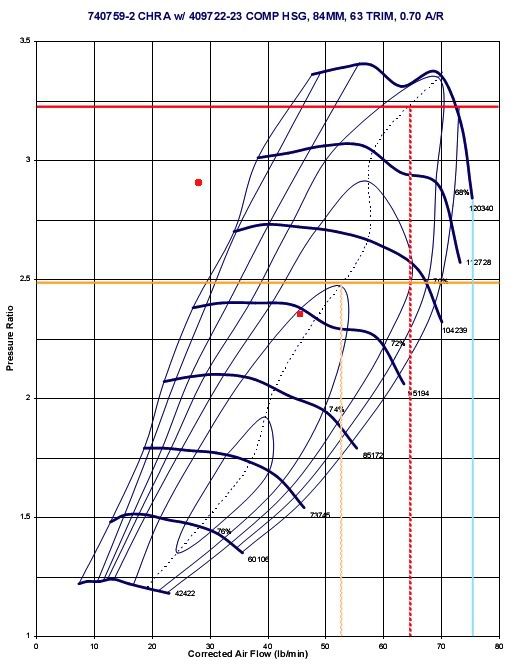
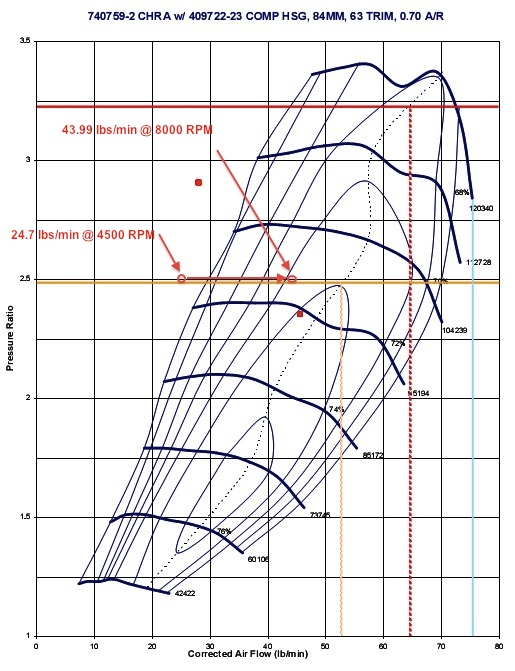
108518, RE: Challenge: plot your setup on the compressor map Posted by Slo2g, Feb-16-11 08:59 PM So I think I got it. I used the T04z compressor map because after some research( I could be wrong) I think this is the closest I could find to the S25g....any who here are my plots, the two red dots on the map. I used Dave's IAT's, pressure loss on intake and compressor outlet, and VE. This is also based off my 2.0 motor so its a 122.04 CI instead of Daves 2.4. | |
|
108519, RE: Challenge: plot your setup on the compressor map Posted by 420agreenvilleSC, Feb-17-11 07:31 AM good thread dave. I didn't see anything wrong with your calculations zac but nevertheless, I suck at math. I don't know what's good or bad nor do I know if I calculated this correctly. As zac did, I used Dave's VE and IM temp #'s. I wanna do more reading on this... interesting. | |
|
108520, RE: Challenge: plot your setup on the compressor map Posted by CODE4, Feb-17-11 08:03 AM Zac, your plot is using two different boost pressures. That is why the plot is weird. Figure your actual boost pressure and use that figure for the last equation to find the actual air flow. In class on my phone right now, will check it when I get out. | |
|
108521, RE: Challenge: plot your setup on the compressor map Posted by Slo2g, Feb-17-11 11:09 AM Maybe Dave, although I don't see how(don't know what I did wrong). I used 18psi and I actually used 420hp but it should be more(I was going off what my car actually made on the dyno and not crank hp.) I'm awaiting your responce :D | |
|
108522, RE: Challenge: plot your setup on the compressor map Posted by CODE4, Feb-17-11 05:51 PM
| |
|
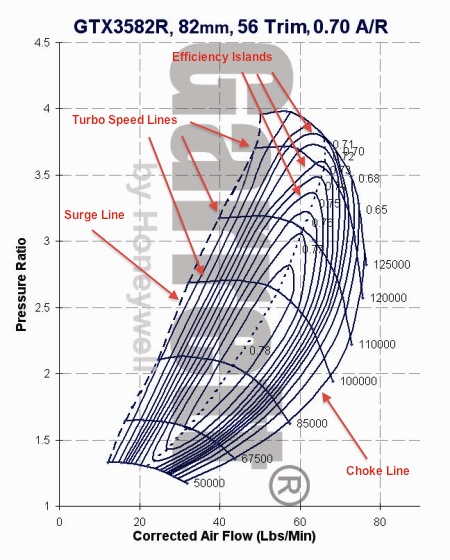
108524, How To Read Turbo Compressor Map | Explained Posted by CODE4, Feb-17-11 06:51 PM For those that have a tough time reading a compressor map, I will break it down so that using the calculations in the first post, you can easily find a compressor that will suit your needs. | |
|
108528, RE: How To Read Turbo Compressor Map | Explained Posted by 420agreenvilleSC, Feb-18-11 07:02 AM epic. thanks dave | |
|
108529, RE: How To Read Turbo Compressor Map | Explained Posted by Slo2g, Feb-18-11 07:30 AM Nice, Dave. Now here is another question. What happens to the eff chart when boost is introduced into the turbo via another turbo. Then inlet pressure would be positive and more than atmospheric. Where would that move the efficiency range? | |
|
108531, RE: How To Read Turbo Compressor Map | Explained Posted by CODE4, Feb-18-11 12:34 PM Hmm interesting question. Without searching/researching the intrawebz, I imagine you add the boost pressure feeding the turbo to 14.7 (atmosphere). Since the P1C is higher, the pressure ratio drops, placing you lower on the compressor map. Subsequently, you can up the boost pressure of the second turbo to bring P2C higher, and bringing your pressure ratio back up. So I would imagine that running sequential turbos allows the second turbo to be run at a much higher boost pressure without operating off the compressor map. | |
|
108532, RE: How To Read Turbo Compressor Map | Explained Posted by Slo2g, Feb-18-11 12:48 PM Exactly :D Looks like the lbs/min would jump up drasticly as well but staying within the turbos efficiency range meaning more airflow at a lower temp than just upping the boost. At least in theory... | |