#108524, "How To Read Turbo Compressor Map | Explained" In response to In response to 0
For those that have a tough time reading a compressor map, I will break it down so that using the calculations in the first post, you can easily find a compressor that will suit your needs.
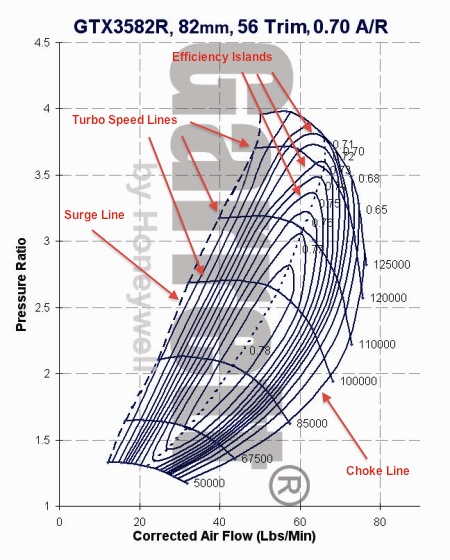
Efficiency Islands: concentric islands referencing the compressor's efficiency - 0.78 = 78%, etc.
Turbo Speed Lines: the large numbers next to the somewhat horizontal lines that drop down towards the right side of the map. These lines refer to turbo speed at particular pressure ratio vs. air flow plots. At points between these lines, the turbo speed can be directly interpolated.
Surge Line: the dotted line on the furthest left of the compressor map. Air flow at or near this point is on the verge of compressor surge. For example, without the use of a BOV, when the engine is in boost and the throttle plate is slammed shut (for example, shifting gears) the pressure remains constant however the airflow drops hard to the left. Typically, compressor housings that have ported shrouds will have the surge line extended more to the left. Operating at or near the surge line is not healthy for the turbo.
Choke Line: compressor flow limit. Operating near this line approaches the point where the turbo tends to fall on its face (for example, 16G at 8000 RPM). As the compressor approaches this line the flow limit is reached and the compressed air temperature rises quickly.
When selecting a turbo, calculate your horsepower target using the calculations in the first post. Then calculate the required pressure to support that airflow and horsepower at desired RPM. Ideally, you want the majority of your time in boost to be in the highest efficiency island as possible. This will differ greatly for engines used specifically for drag racing (all time spent above 5000 RPM) or street applications where boost is desired at 2500 RPM.