#108522, "RE: Challenge: plot your setup on the compressor map" In response to In response to 7 Feb-17-11 07:03 PM by CODE4
Originally posted by Slo2g Maybe Dave, although I don't see how(don't know what I did wrong). I used 18psi and I actually used 420hp but it should be more(I was going off what my car actually made on the dyno and not crank hp.) I'm awaiting your responce
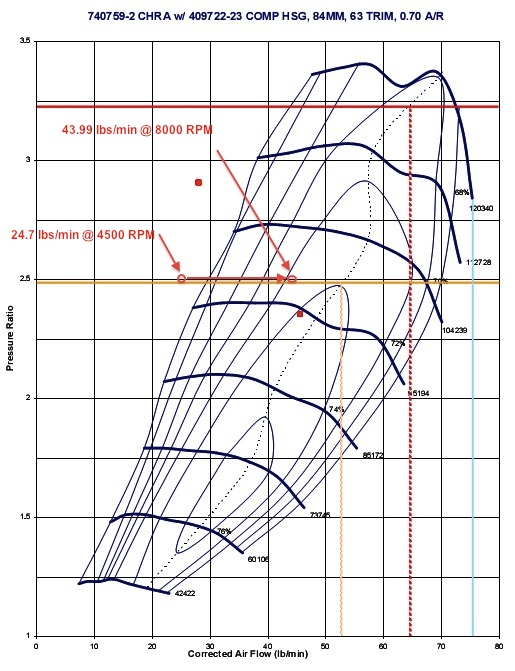
***Annotated worksheet in first post to make the different calculations clearer. Plotting points on compressor map with known boost pressure requires the last equations only!***
Zac, I think the confusion stemmed from my calculation example. Really, to plot the mass air flow all one needs to do is use the last equation to solve for Mass Air Flow. The MAP psia is Manifold Pressure + System Loss (I used 2 psi for this example) + atmosphere (14.7). The pressure ratio should be the same across different RPM points, unless of course boost creep is happening or you have a 2 stage boost controller.
AirFlow(actual) = ((MAP psia) * VE * (N/2) * Displacement) / (639.6 * (460 + IM Temp))